Every council decides differently
The same extension can sail through in one authority and be refused in the next. These are real approval rates from 303 English planning authorities, taken from their own statutory returns.
Figures cover 2025 Q2 to 2026 Q1 and come from the MHCLG district planning application statistics, the returns every English planning authority is required to file. Article 4 and conservation area counts come from the government Planning Data platform. Last refreshed 2026-08-16.
Highest approval rates
Authorities deciding 300 or more householder applications a year, so the percentages mean something.
| Council | Approved | Decisions | In 8 weeks | Region |
|---|---|---|---|---|
| Fareham | 99.2% | 394 | 99.7% | South East |
| North Kesteven | 98.7% | 310 | 98.7% | East Midlands |
| Hammersmith and Fulham | 98.6% | 560 | 90.3% | London |
| Breckland | 98.2% | 342 | 94.8% | East of England |
| North Devon | 97.7% | 301 | 98.0% | South West |
| South Oxfordshire | 97.6% | 871 | 96.4% | South East |
| Amber Valley | 97.5% | 362 | 99.6% | East Midlands |
| Cheltenham | 97.5% | 570 | 96.9% | South West |
Toughest to get through
A lower rate usually means more constraints, not a hostile council. It does mean the design has to work harder.
| Council | Approved | Decisions | In 8 weeks | Region |
|---|---|---|---|---|
| Barking and Dagenham | 68.0% | 406 | 100.0% | London |
| Rotherham | 70.6% | 402 | 100.0% | Yorkshire and the Humber |
| Windsor and Maidenhead | 73.5% | 970 | 94.1% | South East |
| Hounslow | 74.7% | 704 | 97.3% | London |
| Mole Valley | 76.0% | 534 | 74.0% | South East |
| Epping Forest | 76.1% | 777 | 95.3% | East of England |
| Gravesham | 77.5% | 400 | 95.7% | South East |
| Greenwich | 77.6% | 647 | 94.2% | London |
Approval rates are the council's. The verdict is yours.
The tables above tell you how a council decides. The Project Calculator applies its rules to your house and gives you a verdict and a cost, before you speak to anyone.
Open the Project Calculator 60 seconds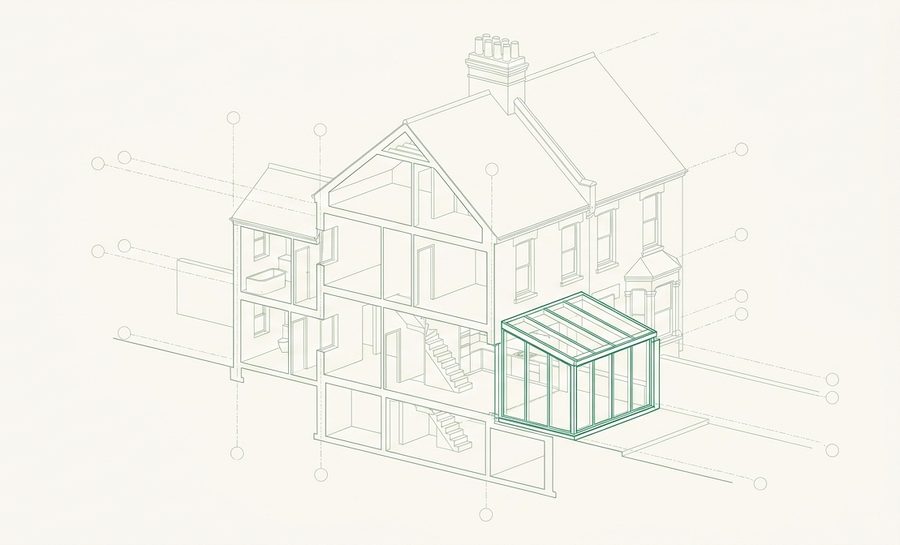
Find your council
East Midlands 35
East of England 45
London 32
National Parks 9
North East 12
North West 35
South East 64
South West 26
West Midlands 30
Yorkshire and the Humber 15
Common questions
Which UK council approves the most planning applications?
Of authorities deciding 300 or more householder applications a year, Fareham tops the list at 99.2%. The national average across all 303 authorities we track is 91.0%, which is far higher than most homeowners expect.
Which councils are hardest to get permission from?
Barking and Dagenham has the lowest householder approval rate among busy authorities at 68.0%. A low rate usually reflects more constraints and more marginal submissions rather than hostility. A well judged scheme in a difficult borough still beats a careless one in an easy borough.
Where does this data come from?
The district planning application statistics that every English planning authority files with MHCLG each quarter, covering 2025 Q2 to 2026 Q1. Article 4 and conservation area counts come from the government Planning Data platform. We refresh it quarterly when the new returns are published.
How do I find which council covers my address?
Your postcode determines it. Enter it into the free feasibility sketch tool and we will tell you which authority decides your application, along with its approval rate and local constraints.